Some time ago two interesting articles have been posted about creating dashboards in XQuery. One of the articles makes use of the Google Chart API to render graphs and inspired me to add a charting facility to eXist-db using the JFreeChart library.
this article is a reconstruction of an article originally written on 14 april 2009
JFreeChart
Getting Started
The new module is made available as an extension module and is not built by default. To enable the extension perform the following steps:
- Edit
extensions/build.propertiesand follow the instructions - Change
include.module.jfreechart = falseto true - Change
include.module.fop = falseto true for SVG support (new) - Uncomment the module in
conf.xml(conf.xml.tmpl) - Run
build.sh
All required files are downloaded as the module is built. After the build completes the new module's functions are available for use.
How to use
The module provides two functions:
This function renders the image into a base64 encoded blob, while -
renders the image directly to the HTTP response (via. the servlet output stream). This function can only be used in the REST interface.
Both functions accept the same set of parameters: a is the chart type, b are the chart settings and c is the chart data.
a : chart type
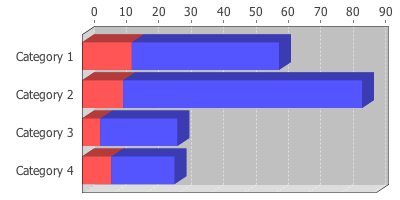
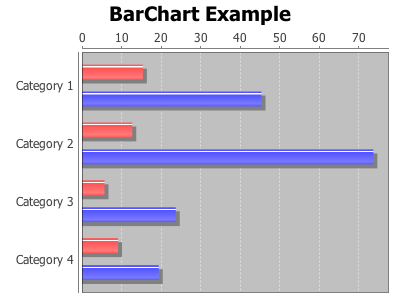
Not all JFreeChart types are available (yet). At present the following charts are available:
LineChart, LineChart3D, MultiplePieChart, MultiplePieChart3D, PieChart, PieChart3D, RingChart, StackedAreaChart, StackedBarChart, StackedBarChart3D, WaterfallChart.
b : chart settings
Parameters are passed as a node, with the element names reflecting the parameters of the original JFreeChart classes:
| Parameter | Description | |
|---|---|---|
| categoryAxisColor | the color of the category axis (#) | |
| categoryAxisLabel | the label for the category axis | |
| categoryItemLabelGeneratorClass | Set implementing class (see javadoc) (#) | |
| categoryItemLabelGeneratorNumberFormat | (see constructors implementing class in javadoc) (#) | |
| categoryItemLabelGeneratorParameter | (see constructors implementing class in javadoc) (#) | |
| chartBackgroundColor | - | |
| domainAxisLabel | the label for the category axis | |
| height | Height of chart, default is 300 | |
| imageType | type of image: "png", "svg" or "svgz" | |
| legend | a flag specifying whether or not a legend is required | |
| order | the order that the data is extracted; "Column" (default) or "Row" | |
| orientation | the plot orientation; "Horizontal" (default) or "Vertical" | |
| pieSectionLabel | (see javadoc) | |
| pieSectionNumberFormat | (see javadoc) | |
| pieSectionPercentFormat | (see javadoc) | |
| plotBackgroundColor | (#) | |
| rangeAxisLabel | the label for the value axis | |
| rangeLowerBound | (#) | |
| rangeUpperBound | (#) | |
| sectionColors | list of colors, applied sequentially to setSectionPaint (#) | |
| sectionColorsDelimiter | delimiter character for sectionColor | |
| seriesColors | (#) | |
| tableOrder | value "column" or "row" (see javadoc) (#) | |
| timeAxisColor | (#) | |
| timeAxisLabel | (#) | |
| title | the chart title | |
| titleColor | (#) | |
| tooltips | configure chart to generate tool tips? | |
| urls | configure chart to generate URLs? | |
| valueAxisColor | (#) | |
| valueAxisLabel | the label for the value axis | |
| width | Width of chart, default is 400 |
(#) indicates new added parameters. A small example:
c : chart data
Two of the JFreeChart datatypes can be used : CategoryDataset and PieDataset. The module attempts to determine and read the correct Dataset for a graph.
For most of the charts the CategoryDataset is used. The structure of the data is as follows:
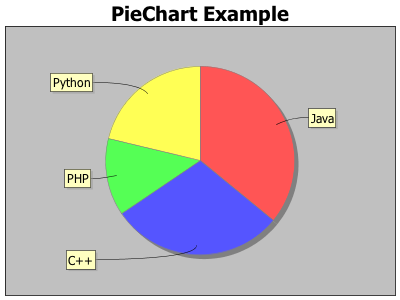
For a subset of charts the PieDataset is used:
Example
Putting it all together:
and
More info
- A number of examples are included with the code
- A pre-compiled version of the extension can be downloaded from existdb-contrib (in exist-modules.jar).
Todo's
Code is never finished. Although in trunk the code has been reworked, there are always things that could be added....
- Add more charts
- Add further Dataset types
- Make direct use of eXistdb nodes, instead of serializing data first to a data stream and have it parsed by the JFreechart parser. Current solution is multi-threaded though (serialize and parse on 2 separate threads)
- Add function for showing all supported Graphs
- Set parameters as provided by JFreeChart.class
- Transparency etc etc